

Tracing the Invisible: Climate TRACE’s Neighborhood Pathways of Pollution
Climate TRACE, a nonprofit coalition co-founded by Al Gore, released an interactive map that visualizes how PM2.5 pollution moves from industrial sources through thousands of cities worldwide. The interface renders orange dots as point sources and animated streams showing transport pathways under prevailing winds. Built from a fusion of local emissions and weather data, the tool currently offers snapshots of average and high pollution days, with plans to evolve into near real-time monitoring that can guide daily decisions for vulnerable households.
Beyond visualization, the platform links particulate exposure at neighborhood scales to health outcomes, foregrounding places like Louisiana’s Cancer Alley to show cumulative burdens. It also compensates for gaps left by declining regulatory reporting, presenting an independently derived, public-facing evidence layer that policymakers, firms, and communities can use to target “super-emitters” and accelerate cleaner technologies.
The case exemplifies how data assemblages recalibrate environmental governance by coupling remote sensing, ground sensors, and algorithmic modeling into a legible public artifact. It operationalizes a politics of visibility: transforming diffuse emissions into traceable flows reconfigures accountability from abstract national inventories to situated neighborhood harms. The interface is not neutral; design choices—color intensity, dot scale, plume animation—perform semiotic labor that frames salience and moral urgency. By linking pathway maps to health indicators, the system activates socio-technical imaginaries in which corporate sites become proximate agents in everyday risk. At the same time, model uncertainty, calibration limits, and coverage asymmetries can reproduce uneven epistemic authority, favoring well-sensed geographies while undercounting informal or mobile sources. The platform participates in data ratcheting: initial snapshots establish a baseline public ontology, followed by iterative expansion toward operational integration in planning, permitting, and corporate disclosure. As a counter-data intervention, it challenges regulatory retreat by enlisting lay publics and city officials into a shared evidence economy, yet it raises questions of data justice regarding consent, remediation pathways, and the potential for surveillance spillover.
Practical Implications for Organizations
- Prioritize hyperlocal exposure metrics to align ESG claims with neighborhood health realities and reduce greenwashing risk.
- Integrate plume-pathway analytics into site selection, logistics routing, and maintenance schedules to mitigate downwind externalities.
- Use third-party, near real-time evidence to verify emissions disclosures and to benchmark suppliers and subsidiaries.
- Co-design with affected communities to ensure data justice, including transparent uncertainty ranges and accessible interfaces.
- Build escalation protocols that translate threshold exceedances into operational actions and public communications within hours.
- Leverage the map’s salience in stakeholder engagement, linking investments in cleaner processes to measurable reductions along specific pathways.
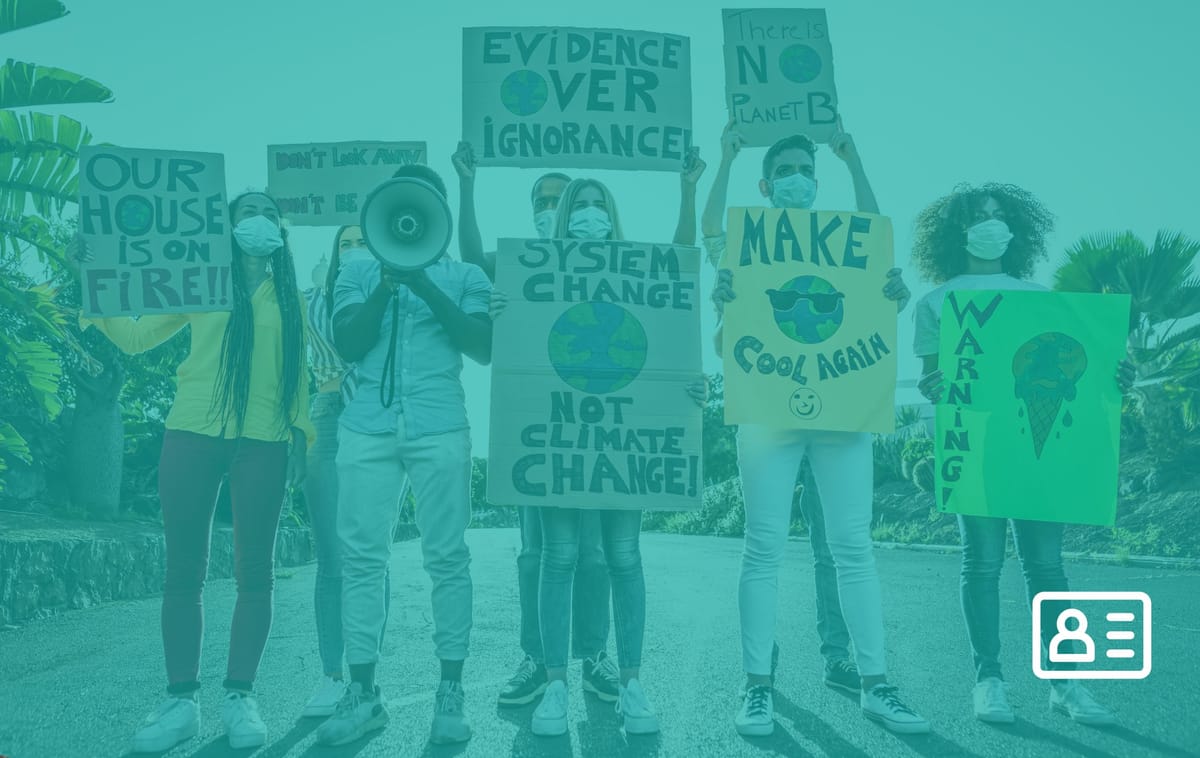
Consumer tribes that may relate to this case study: